
Lightweight Docker monitoring for containers and services
EaDoMo is a lightweight self-hosted Docker monitoring tool for teams that want visibility into containers, web services, servers, and Java applications without spending days configuring large monitoring stacks.
It is designed for small and mid-sized deployments, easy to install, and easy to run. The only thing it requires to operate is a connection to your Docker socket. Apart from Docker containers, EaDoMo can also monitor servers, web services, and Java applications providing access to JMX.
EaDoMo uses MongoDB to store data and can inform you about service outages using Telegram and Slack channels.
EaDoMo is built for lightweight Docker monitoring in smaller deployments and helps you keep track of the containers and services running inside your environment.
If you need a self-hosted monitoring tool that is easier to start with than larger enterprise platforms, EaDoMo gives you quick setup, practical health checks, and a clear dashboard. Apart from Docker containers, it can also monitor servers, web services, and Java applications providing access to JMX.
EaDoMo uses MongoDB to store data and can send outage notifications through Telegram and Slack.
Docker pull command
docker pull eadomo/eadomo
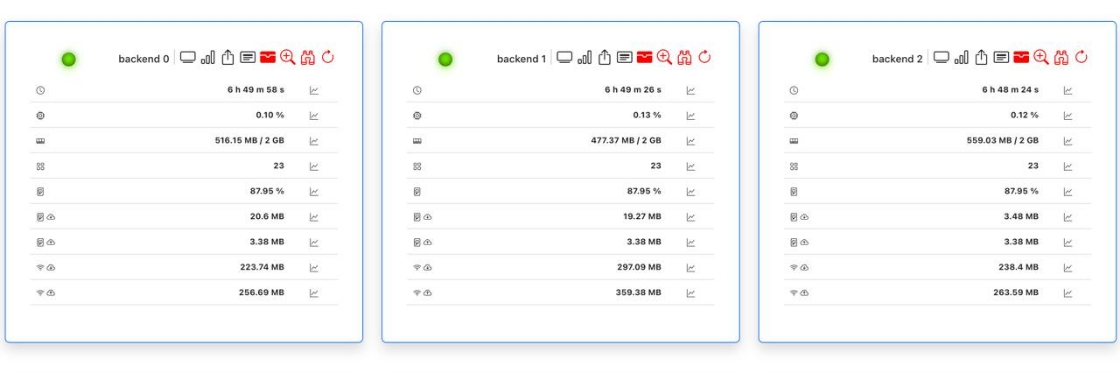
Built-in Docker monitoring overview

The built-in monitoring view helps you inspect container health, restarts, open ports, image updates, and runtime statistics from one lightweight Docker monitoring dashboard.
Docker monitoring dashboard
EaDoMo provides a self-hosted Docker monitoring dashboard for container status, service visibility, and operational checks without the overhead of a full enterprise monitoring stack.
How to run EaDoMo for Docker monitoring
The recommended way to run EaDoMo is with Docker, either directly or through docker-compose, so you can start monitoring containers quickly.
To monitor local host:
    docker run -d -v /var/run/docker.sock:/var/run/docker.sock \
    -v $PWD/eadomo.yml:/etc/eadomo.yml \
    --net=host \  # not required, only to simplify host ports monitoring
    --restart unless-stopped \
    -p 5555:5555 \
    --name eadomo \
    --env-file env.env \
    eadomo/eadomo:latest python3 eadomo.py /etc/eadomo.yml
A sample env file:
    ENV_NAME=my-deployment
    ADMIN_MODE=1
    ADMIN_USER=admin
    ADMIN_PASSWORD=secure_password
    ACTIONS_ENABLED=1
    SESSION_SECRET=random-string
    MONGO_URI=mongodb://localhost
    DB_NAME=depl_status
    ALLOWED_CORS_ORIGINS=https://your.host.com
    TELEGRAM_CHAT_ID=12345  # optional, only if telegram is used
    TELEGRAM_TOKEN=your-telegram-token # optional, only if telegram is used
    SLACK_CHAT=my-system-notifications # optional, only if slack is used
    SLACK_TOKEN=your-slack-app-token # optional, only if slack is used
To monitor remote host:
    docker run -d -e DOCKER_HOST=ssh://1.2.3.4:22 \
    -v $PWD/eadomo.yml:/etc/eadomo.yml \
    --restart unless-stopped \
    -p 5555:5555 \
    --name eadomo \
    --env-file env.env \
    eadomo/eadomo:latest python3 eadomo.py /etc/eadomo.yml
Or with docker-compose.yml:
    version: '3.5'
    services:
      eadomo:
        image: eadomo/eadomo
        ports:
          - "5555:5555"
        volumes:
          - ./eadomo.yml:/etc/eadomo.yml
          - /var/run/docker.sock:/var/run/docker.sock
        environment:
          ENV_NAME: my-deployment
          ADMIN_MODE: 1
          ADMIN_USER: admin
          ADMIN_PASSWORD: secure_password
          ACTIONS_ENABLED: 1
          SESSION_SECRET: random-string
          MONGO_URI: mongodb://mongo
          DB_NAME: depl_status
          ALLOWED_CORS_ORIGINS: https://your.host.com
          TELEGRAM_CHAT_ID: 12345  # optional, only if telegram is used
          TELEGRAM_TOKEN: your-telegram-token # optional, only if telegram is used
          SLACK_CHAT: my-system-notifications # optional, only if slack is used
          SLACK_TOKEN: your-slack-app-token # optional, only if slack is used

      mongo:
        image: mongo:4
        volumes:
          - mongo:/data/db

    volumes:
      mongo:
By default EaDoMo exposes port 5555 as an unencrypted HTTP connection and is available in /dashboard context: http://your-host:5555/dashboard. If you want HTTPS, please run it behind a reverse proxy, for instance, NGINX.

Docker monitoring features
Docker containers
EaDoMo verifies the following Docker container monitoring signals:
- if the container running
- if the container has been restarted recently (planned/unplanned)
- if a port exposed is open and listening
- if a newer image is available
- (on gitlab) if new commits were pushed into the development branch which are not on deployment branch yet
It also gathers statistics on:
- uptime
- memory used
- CPU used
- disk usage
- network traffic
Web services
EaDoMo verifies:
- if a port is listening
- SSL certificate validity
JMX services
EaDoMo gathers statistics on:
- uptime
- memory used
- CPU used
- disk usage
- network traffic
How EaDoMo Docker monitoring works
Docker itself exposes a lot of useful runtime data, and EaDoMo turns those capabilities into a practical self-hosted Docker monitoring workflow. Monitoring of services is done either by checking open port availability or, in case Zabbix agent is available, by fetching node information from it. For JMX applications EaDoMo launches a proxy container within the target container namespace which fetches information and provides it to EaDoMo via Docker connection, so there are no additional communication channels opened between the monitored host and the host where EaDoMo is running.
Docker monitoring FAQ
What is EaDoMo?
EaDoMo is a lightweight self-hosted Docker monitoring tool for containers, web services, servers, and Java applications.
Can EaDoMo monitor remote Docker hosts?
Yes. EaDoMo can monitor remote Docker hosts, including setups that connect through DOCKER_HOST over SSH.
Does EaDoMo support alerts?
Yes. EaDoMo can notify you about service outages through Telegram and Slack channels.
What can EaDoMo monitor besides Docker containers?
Besides Docker containers, EaDoMo can monitor web services, servers, and Java applications exposed through JMX.